
In short. Bitcoin trades at $78,248, 37% below the peak of 6 October 2025. A year after the peak the market is in a bear phase, but a shallower one than any before: the lowest point, 53% below the peak, came on 30 June 2026; the price then rebounded to $86,603 (21 September 2026) and has given back 10% since. The halving calendar puts the typical cycle bottom on 12 November 2026, 11 days from now; the accumulation window opens that day and runs to 7 January 2027. Two signs of a bottom have already appeared, in a mild form: in the summer the price closed below the 200-week average for 27 days, and sentiment fell into extreme fear twice. Three are missing: the decline is half as deep as the previous bear markets, long-term holders are still in profit, and the on-chain gauges have not gone below zero.
1. Where we are in the cycle
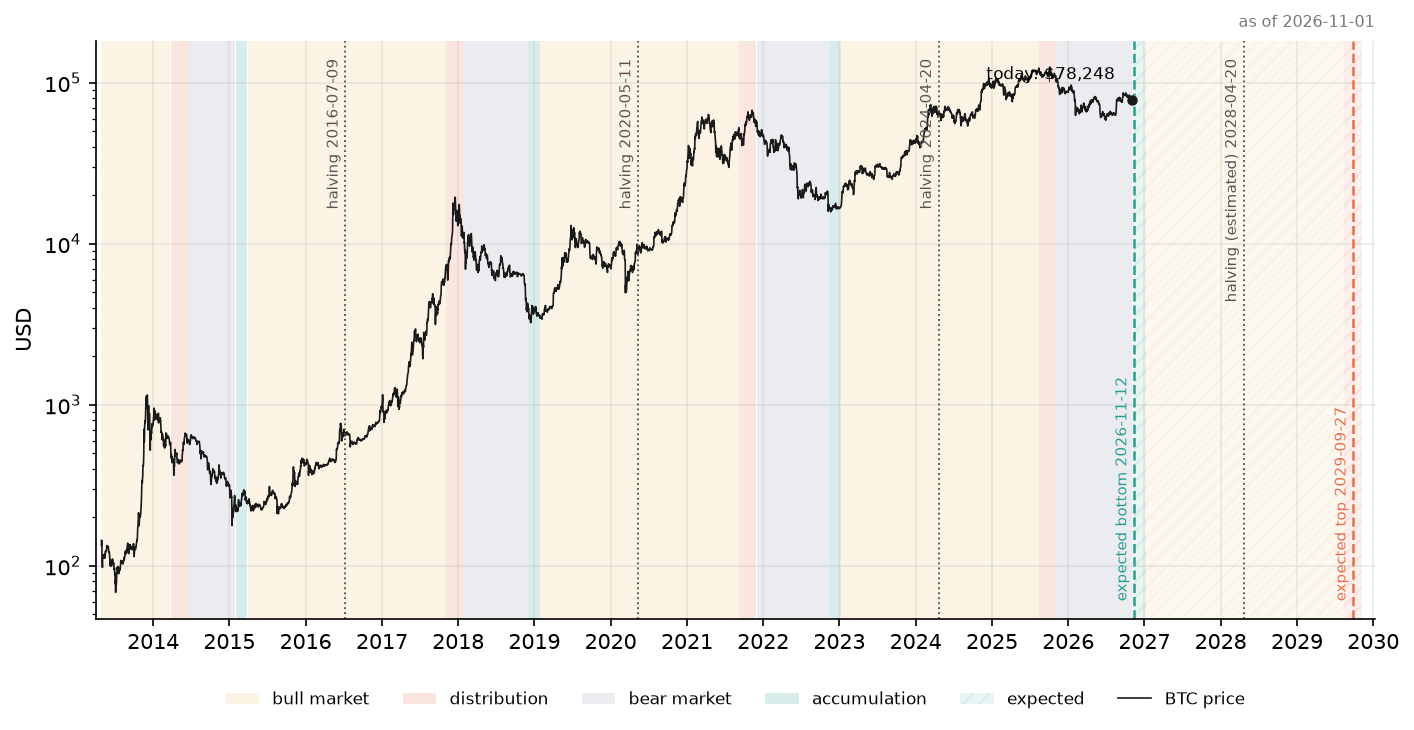
The bitcoin market moves to the rhythm of the halving, the cut of the miners’ reward by half every four years or so. On the chart every cycle has four phases: accumulation around the bottom (green band), the bull market, distribution around the peak (red band) and the bear market (grey band). In the previous cycles the bottom came about 525 days before the halving and the peak about 150 weeks after the bottom, just under three years; the phase boundaries on the chart follow from those two numbers and the halving dates, not from the price. The hatched bands show how the same calendar runs ahead, with the next halving estimated for 20 April 2028.
We have been in the bear phase since 9 November 2025. The last halving was on 20 April 2024, 925 days ago; the next one is 536 days away. The cycle peak came on 6 October 2025 at $124,753, 391 days ago, a little over a year; the last two bear markets took 364 and 378 days from peak to low. The calendar puts the typical cycle bottom on 12 November 2026, with the accumulation window running 8 weeks after it, to 7 January 2027.
The timing fits; the depth does not. In the three previous cycles the bottom meant a fall of 77% to 85% from the peak; this time the price fell at most 53%, to $58,559 on 30 June 2026, and has since recovered to $78,248. To enter the zone we mark on the charts as typical for a bottom (60 to 80 percent below the peak) the price would have to drop to $49,901, 36% below today’s level. The third thing we look at near a bottom is the long moving averages: today the price is 3% above the 50-week average ($75,729) and 16% above the 200-week average ($67,464). The summer looked different: from 5 June 2026 to 16 August 2026 the price closed below the 200-week average on 27 days, at most 7% under it, and came back above both lines in September.
Summary. The cycle clock points at a bottom and the price confirms it only in part: the 200-week average was touched, but shallowly, and the decline is half the size of the previous bear markets. Either this cycle is milder than the previous ones, or the lowest point is still ahead. The coming weeks, inside the accumulation window, will decide.
2. The market in numbers
Bitcoin: $78,248 (7 days: −2.2%; 30 days: −7.4%)
Whole crypto market: $2.65 trillion (7 days: −2.1%; 30 days: −8.8%)
Whole-market turnover, 7-day average: $139 billion (7 days: +7.7%; 30 days: −21.2%)
Bitcoin turnover, 7-day average: $27 billion (7 days: +8.2%; 30 days: −15.6%)
Market turnover to market value, 7-day average: 5.2% (7 days: +0.5 pp; 30 days: −0.9 pp)
Bitcoin’s share of the market: 59.4% (7 days: 0.0 pp; 30 days: +0.9 pp)
Ether in bitcoin (ETH/BTC): 0.0290 (7 days: −0.1%; 30 days: −8.0%)
The 7-day-average items compare this week with the week 7 and 30 days earlier.
The week closed with a small loss: bitcoin lost 2.2%, the whole market about the same, and bitcoin’s share of the market stands still at 59.4%; money is flowing neither into altcoins nor out of them. Turnover: this week $139 billion a day changed hands on average across the whole market, 7.7% more than in the previous week and 21.2% less than in the week one month earlier. Market turnover relative to the market’s value (5.2%) is close to the lowest levels of this bear phase (median 6.8%, bottom decile 5.1%). The market is waiting.
3. How far bitcoin fell after each peak
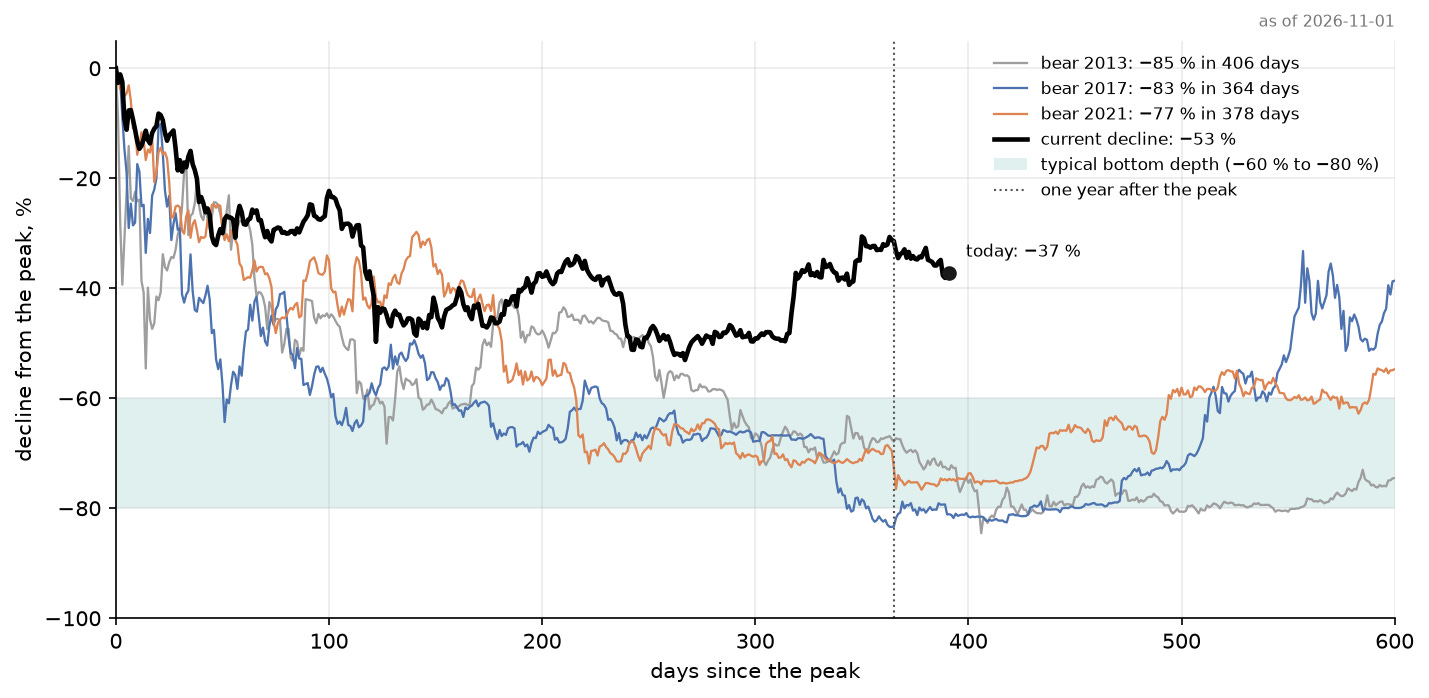
The chart lays the four declines from the peak over each other, day by day, as if each had started on the same day. The three previous bear markets shared one shape: the price lost 77% to 85% and reached its low after about a year. In 2013 the fall was −85% over 406 days, in 2017 −83% over 364 days, in 2021 −77% over 378 days. Each bear market was also a little shallower than the last: the market matures and the capital in it grows.
The current decline looks nothing like them. On day 391 after the peak the price is 37% below it, while on the same day the previous bear markets stood at −73%, −81% and −75%. The deepest point of this decline, 53% below the peak on 30 June 2026, was shallower than every bottom since 2013. The price then rebounded to $86,603 on 21 September 2026 and has been giving ground since: today it is 10% lower. The rule “each bear market shallower than the last” this cycle meets with room to spare; the rule “the bottom between 77% and 85% below the peak” it does not meet at all.
Summary. On day 391 after the peak bitcoin is 37 percentage points higher than it was on the same day of the previous bear market. If this cycle is to reach the typical bottom zone, it needs one more wave of selling of at least 36%.
4. The cycle clock
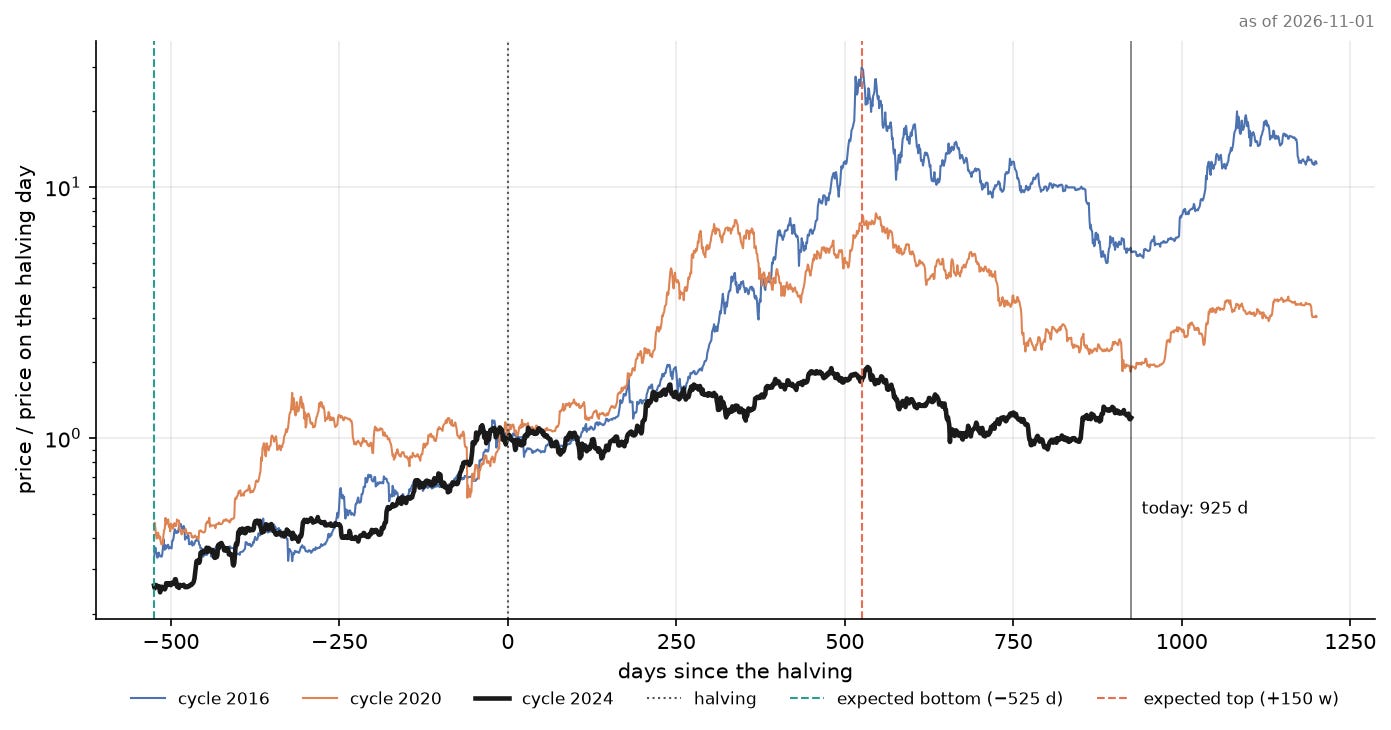
The chart lays the last three cycles over each other, counting days from the halving, with the price expressed as a multiple of the price on the halving day. The 2016 and 2020 cycles looked alike: a peak 525 and 546 days after the halving, then a year of decline and a bottom about 525 days before the next halving. The 2024 cycle keeps the same timing (its peak came 534 days after the halving) but is flat: at the peak the price was 1.9 times the halving-day price, against 30 and 8 times in the two previous cycles. We are on day 925 after the halving, where those cycles were already ending their bear markets.
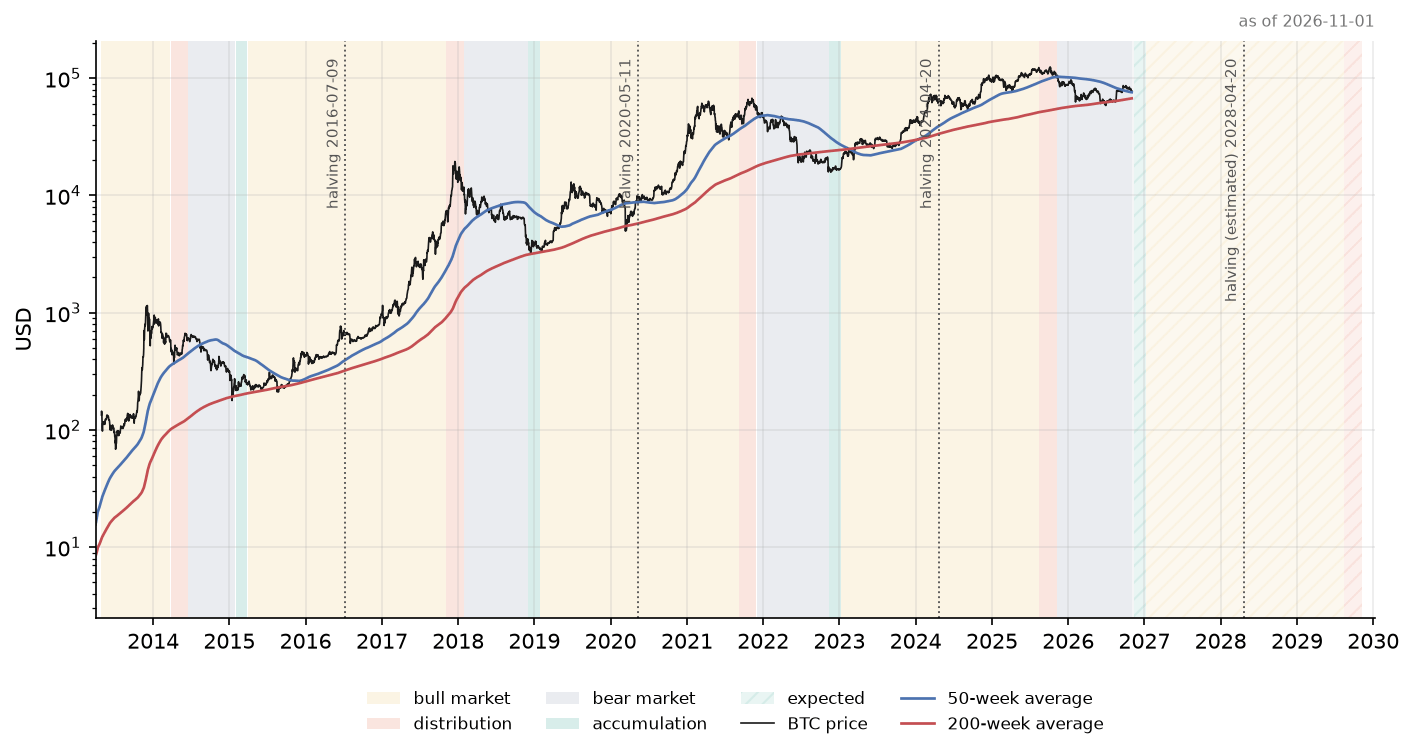
The two averages on this chart best organize bitcoin’s history. The 200-week average (red) is the line of the bottom: in the year around the 2015 low the price closed below it on 31 days in all, at most 7% under it; in 2018 the low stopped 2% above it; around the 2022 low the price spent 317 days below it in all, 34% under it on the low day. The 50-week average (blue) separates bull from bear: in a bull market the price is above it most of the time, in a bear market below it, and a sustained return above this line after the bottom was in every cycle the sign that the bottom was behind. In this decline the price went below the 200-week average for 27 days (5 June 2026 to 16 August 2026), at most 7% under it, which is shallower than in 2015 and 2022, and in September it came back above the 50-week line; today it is 3% above it and 16% above the 200-week one.
Summary. By the cycle clock the bear market should be ending, and the price behaves as if it were: it touched the 200-week average and came back above the 50-week one, which is what it did at the bottom in the previous cycles. It did so, however, from half the height at which those bear markets ended.
5. What the on-chain data says
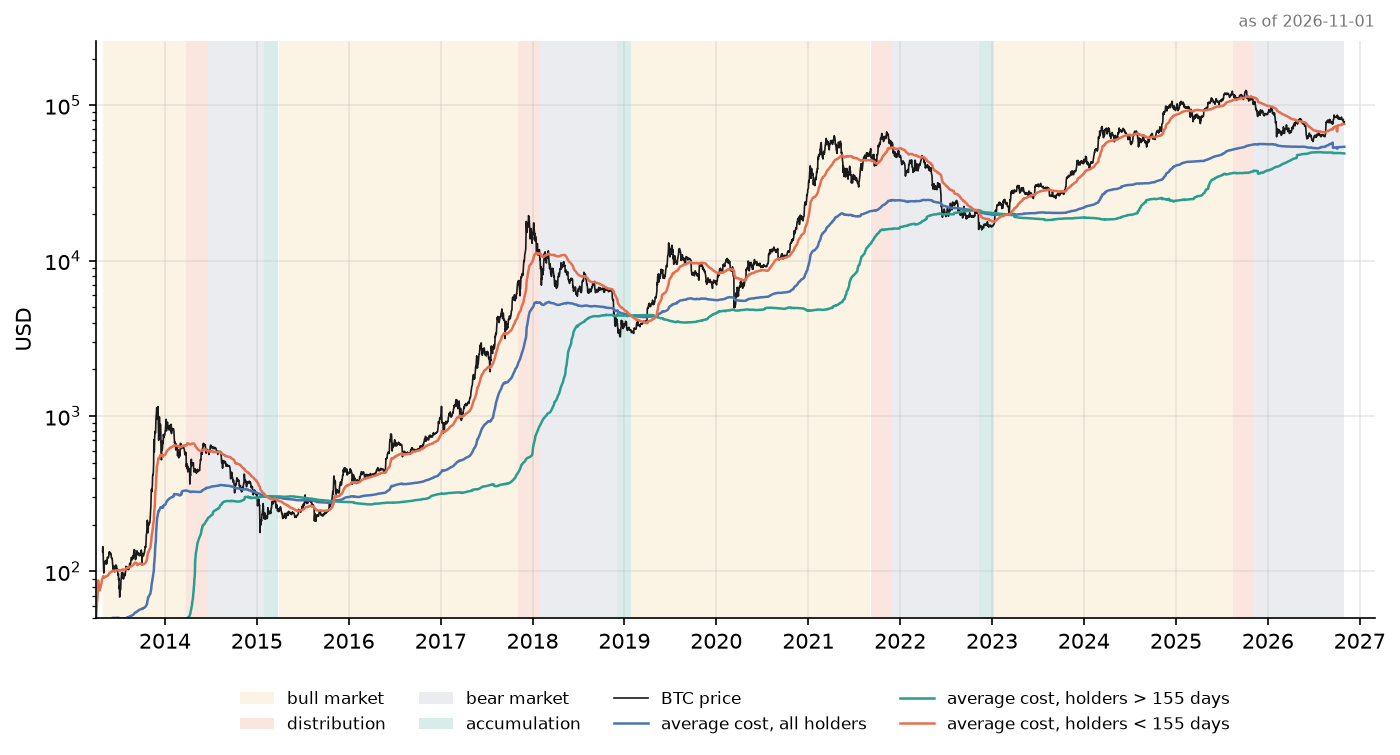
On-chain data lets us compute the price at which holders bought their bitcoin. The average cost of all holders is $54,066 today, that of long-term holders (over 155 days) $49,010, and that of short-term holders $75,718. The price of $78,248 is 60% above the long-term holders’ cost and only 3% above the short-term holders’ cost. At the bottoms of 2015, 2018 and 2022 the price fell below the long-term holders’ cost, so even the most patient were under water; that level is tens of percent away today, and the June low did not reach it either.
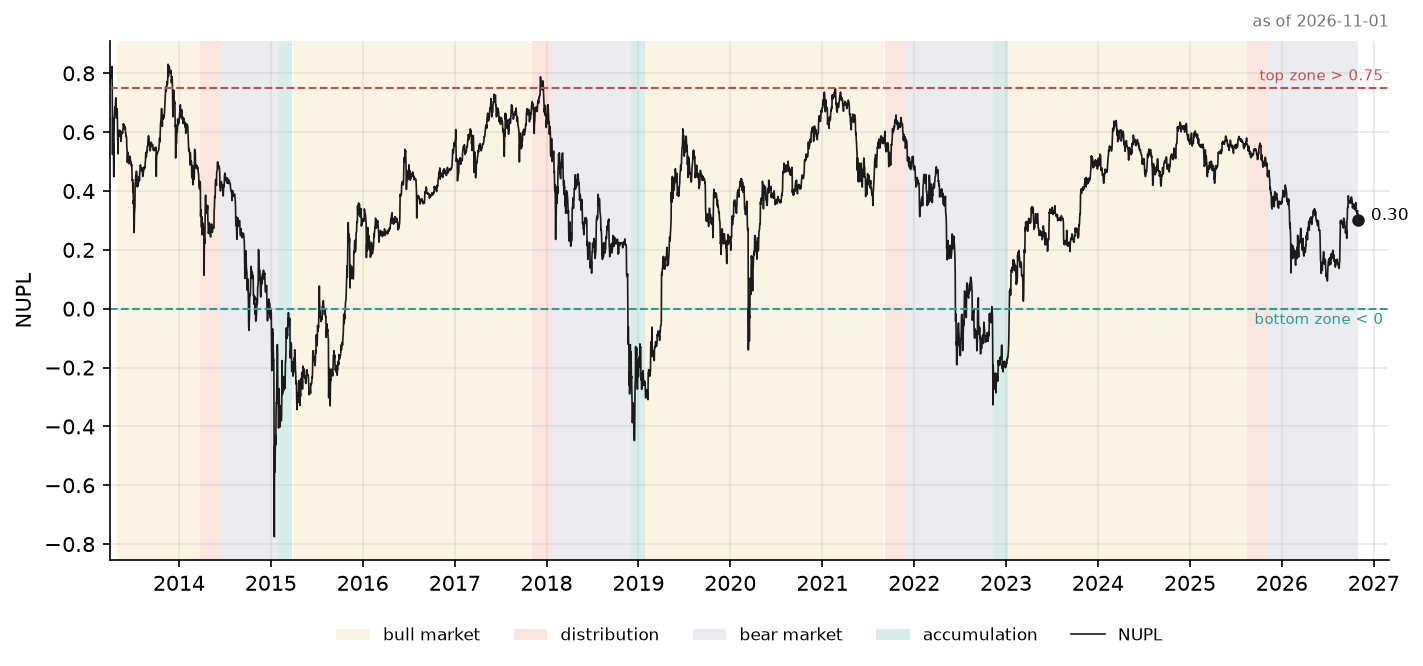
The next two gauges measure the same thing from another side: how much unrealized profit sits in the market. NUPL stands at 0.30 (a week ago 0.33): 30% of the market’s value is profit that holders have not realized yet, and the price is +45% above their average purchase cost. At cycle bottoms the gauge fell below zero; at the peaks of 2013 and 2017 it crossed 0.75, in 2021 it stopped at 0.747, and in this cycle it reached only 0.64.
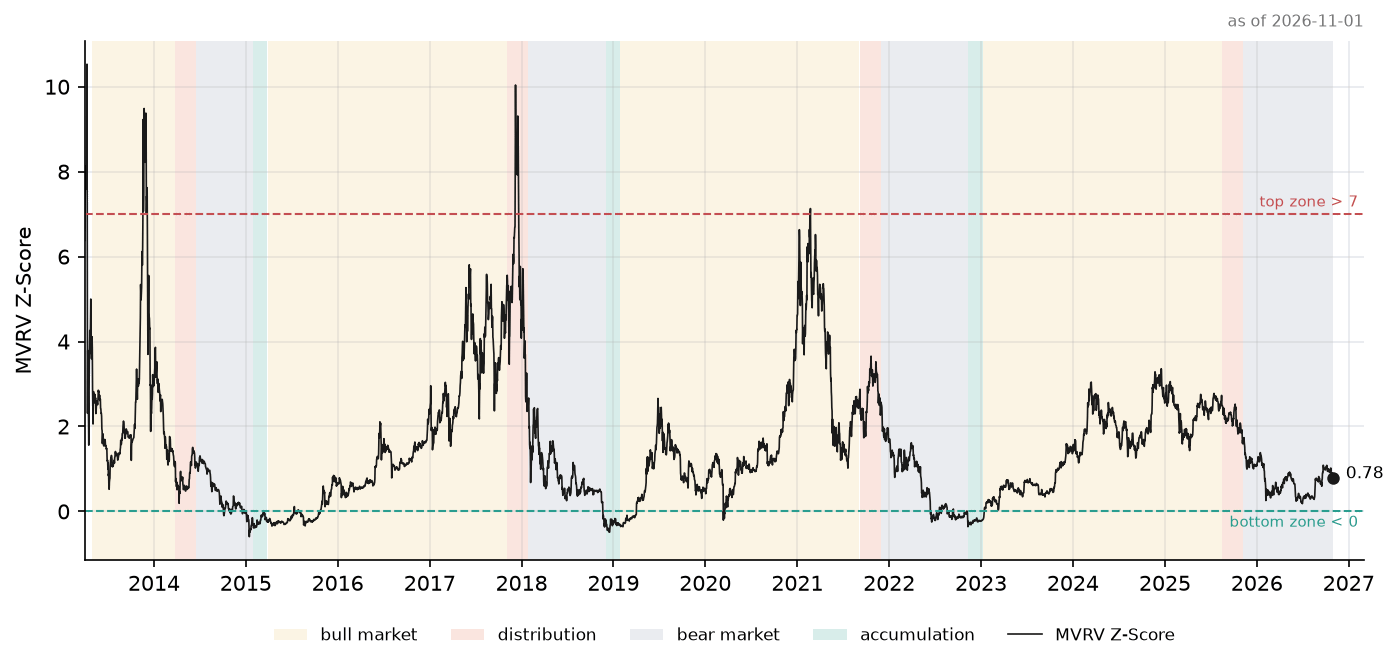
The MVRV Z-Score measures how far the price sits from the average purchase cost and stands at 0.78; cycle bottoms came below zero, the peaks of 2017 and 2021 above seven (7.1 in 2021), and this cycle’s high was 3.4. Both gauges sit today in the lower half of the middle of their range: the market is neither overheated nor sold out.
Summary. The on-chain data says what the price says: bitcoin is as cheap as mid-cycle, not as cheap as a cycle bottom. Long-term holders are far from a loss, and in the previous cycles the bottom only began once they too were under water.
6. Sentiment and altcoins
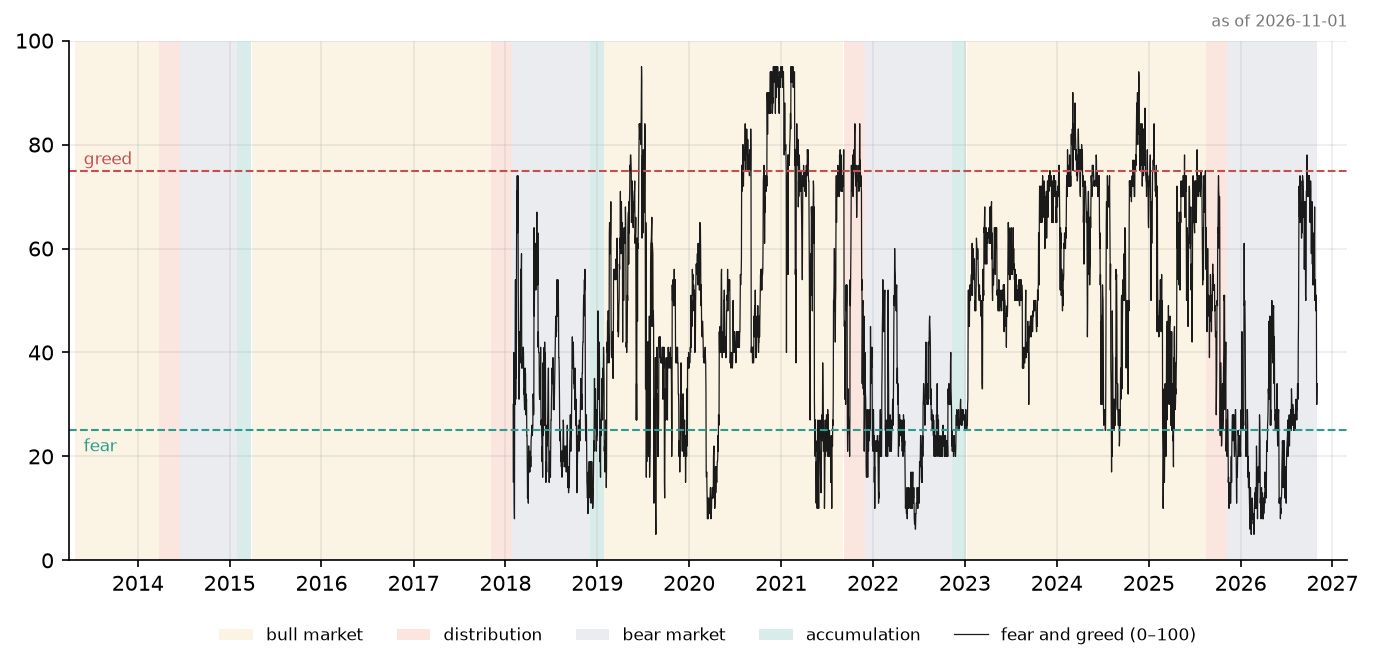
The Fear and Greed index fell within a week from 54 to 34 points, from neutral to fear, although the price moved only −2.2% in that time. Extreme fear, below 25 points, has already happened in this decline, and for a long time: since the peak the index has spent 171 days under that line, at its lowest 5 points on 12 February 2026, and it read 15 on the day of the June low; the last reading below 25 was on 14 July 2026. The capitulation of sentiment that accompanied the bottoms of 2018 and 2022 has therefore already happened twice in this cycle, without a capitulation of the price. No new money is visible: turnover is average and on-chain activity is calm.
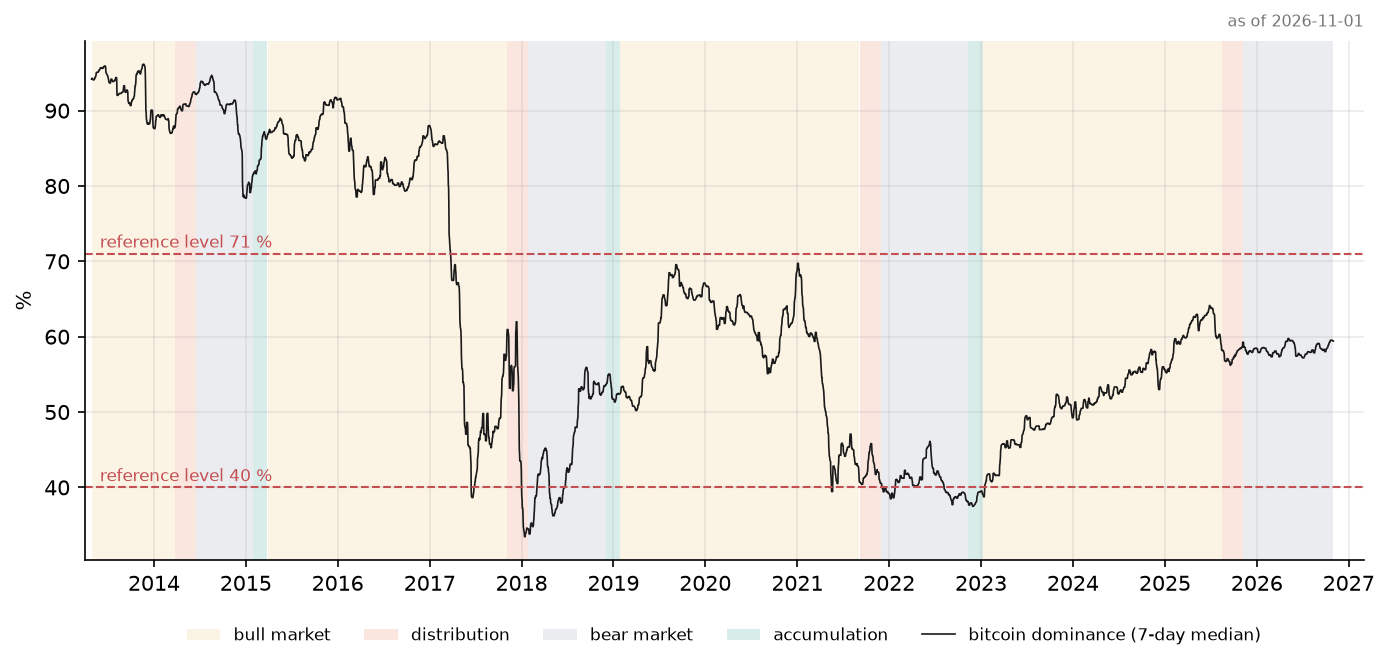
Altcoins are waiting for bitcoin’s bull market. Bitcoin’s share of the whole market is 59.4% and has been rising for a month (+0.9 pp); in the previous cycles the altcoin season began once dominance turned down on rising turnover, with bitcoin above the previous cycle’s peak and above the 50-week average. Today only the last two conditions hold: the price is above $67,567, the 2021 peak, and above the average. Ether against bitcoin lost 8.0% in a month, which confirms that capital is not looking for risk.
Summary. Fear has returned faster than the price is falling, and in February and June it was already extreme. Altcoins do not have their season yet and will not have one until bitcoin's dominance turns down.
7. The week in summary
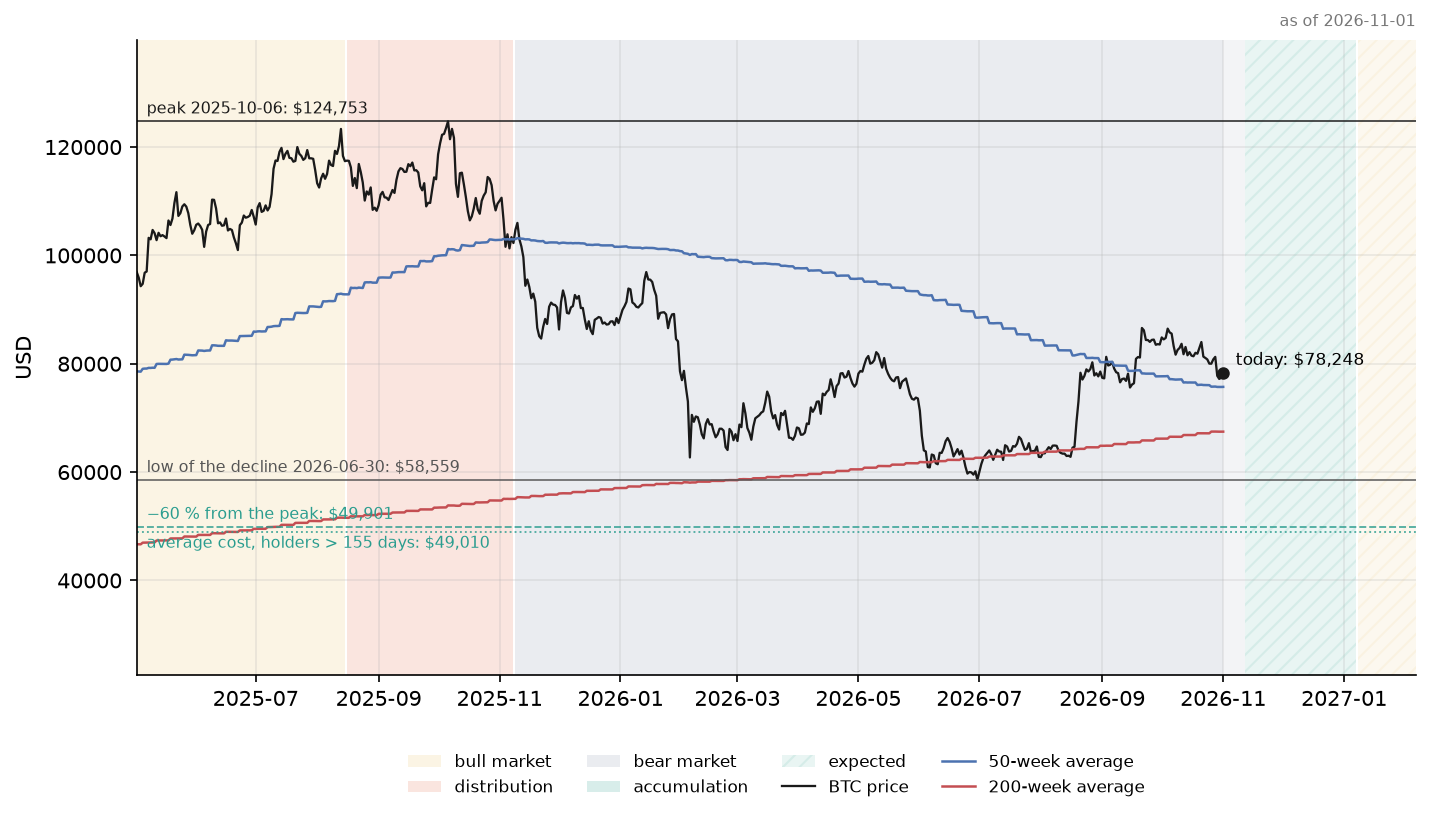
A little over a year after the peak bitcoin stands where the cycle clock says to look for a bottom, and trades at $78,248. Some signs of a bottom have appeared: in the summer the price closed below the 200-week average for 27 days, sentiment fell into extreme fear twice, and in September the price came back above the 50-week average. Since the September rebound to $86,603, however, the market has been giving ground again, by 10%. What has not happened is what defined the bottom in the three previous cycles: a fall of 77% or more, a price below the long-term holders’ purchase cost ($49,010), and on-chain gauges below zero.
What we watch in the coming weeks. On 12 November 2026 the cycle calendar enters the accumulation window, which runs to 7 January 2027; in the previous cycles the bottom fell inside that window (12 and 9 days after it opened, in 2018 and 2022) or just before it (17 days earlier, in 2015). The levels that would confirm a typical bottom are $49,901 (60 percent below the peak) and $49,010 (the long-term holders’ purchase cost). If the accumulation window passes without such a fall and the price holds above the 50-week average, this will be the first cycle in which the bear market ended halfway. We will return to this in every issue.
Data: CoinMarketCap quotes and our own on-chain data, as of 1 November 2026.
Time has a price, and markets pay it. This report is general information and not an investment recommendation in the meaning of the Market Abuse Regulation. © 2026 Price of Time.